Introduction
Quantitative literacy is now central to competent clinical practice and research.1 Residency program directors and medical school educators therefore seek experiential resources that integrate biostatistics with real-world patient outcomes.2 The American College of Surgeons’ National Surgical Quality Improvement Program (ACS-NSQIP)—spanning more than 11 million operations and >200 peri-operative variables—offers such a resource, with validated data abstraction and national benchmarking.3 Beyond research, NSQIP data underpin resident Quality-In-Training Initiative (QITI) curricula that measurably reduce morbidity and improve performance metrics.4
Overview of the ACS NSQIP Database
-
Structure and Content: Annual Participant Use Files (PUFs) include patient demographics, 30-day outcomes, and procedure-targeted modules (e.g., colectomy, mastectomy). The 2023 PUF, for example, captures 994,313 cases across 676 sites with HIPAA-compliant de-identification.5
-
Data Quality: NSQIP employs trained Surgical Clinical Reviewers, inter-rater reliability audits, and risk-adjusted modelling, yielding validated complication rates superior to administrative claims data.6
-
Access: PUFs are freely available to participating institutions; external investigators may apply through the ACS Research Data Center. Institutional NSQIP datasets offer richer variable depth but require site-specific approvals.
-
Strengths & Limitations: Pros include prospective abstraction, granular covariates, and national scope. Limitations encompass 30-day horizon, lack of cost data, and potential selection bias toward participating hospitals.7
Educational Rationale
The American College of Graduate Medical Education (ACGME) has identified quantitative literacy and continuous quality improvement (QI) as core competencies for surgical training.8 Yet many residency programs struggle to provide authentic, data-rich experiences that link statistical concepts to bedside decision-making. ACS-NSQIP answers this need by coupling nationally benchmarked, prospectively collected clinical data with risk-adjustment models familiar to practicing surgeons. For trainees, the database functions as both a “virtual ward” and a “living textbook.” They learn to formulate clinically meaningful questions, verify data provenance, and interrogate outcomes that mirror the complications they encounter in the operating room or during Morbidity and Mortality (M&M) conferences. Equally important, program directors can demonstrate tangible improvements in patient care by tracking institutional NSQIP metrics over time; this aligns with the ACGME Milestones and satisfies reporting requirements for institutional QI initiatives (Table 1). The result is a learning environment in which statistical theory is immediately contextualized, cultivating physicians who can both interpret the literature and design data-driven interventions.
Variables Contained in the NSQIP
A full data dictionary of the ACS-NSQIP can be found online by looking up the “ACS-NSQIP PUF User Guide” (https://www.facs.org/media/ekmnc2ge/nsqip_puf_userguide_2023.pdf).9 The NSQIP contains many different variables ranging from patient demographic variables, to comorbidities, preoperative lab values, surgical details including operative time and anesthetic plan, and 30-day medical, surgical, and composite outcomes.9
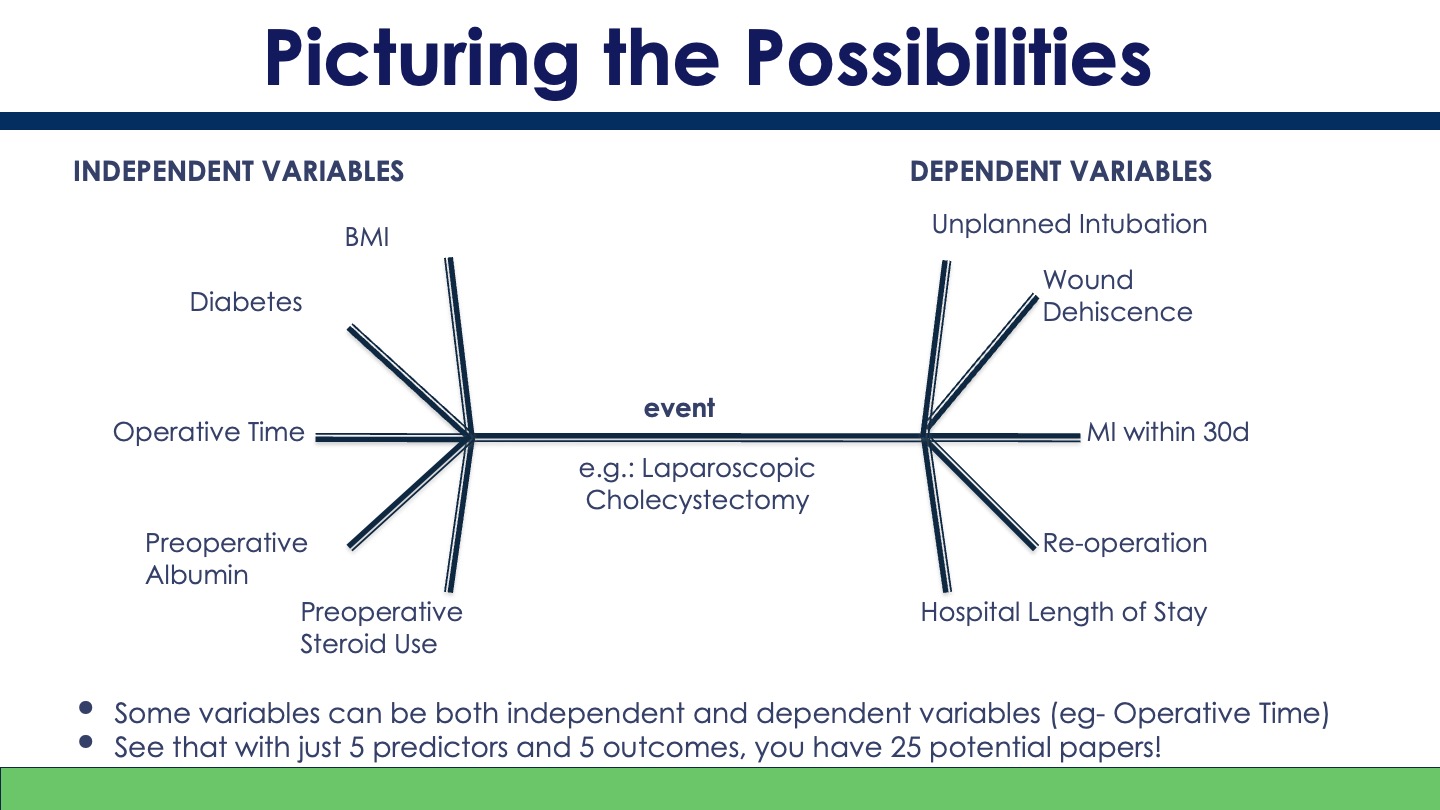
With access to data of this granularity, countless research questions can be methodically tested to determine preoperative variable association with postoperative outcomes, leading to an intuitive retrospective cohort or case-control study design. Independent variables including demographics, patient comorbidities, and preoperative lab values coded in the NSQIP are shown in Table 2.
30-day outcomes of interest detailed in every version of the NSQIP are shown in Table 3.
Study Designs using the NSQIP
The Participant Use Files (PUFs) capture every operation as a time-stamped “exposure,” pair it with > 200 pre-operative covariates and track 30-day outcomes. That structure supports the two observational designs residents most commonly learn: retrospective cohort and case-control.10
Retrospective Cohort
Workflow. Educators first filter the PUF by procedure-specific CPT codes, define a pre-operative exposure, and then “follow” the entire cohort forward to observe NSQIP-defined complications. Multivariable regression can adjust for confounders such as age, ASA class, and operative time, all of which are natively coded in the dataset.11
Retrospective cohort designs offer the advantage of being able to report a relative risk (RR), which makes a stronger statement of the relationship between two variables than the odds ratio (OR), which is the only metric that can be reported in case-control study designs.12 RR can be easily calculated by doing a chi-square analysis.12
Example. In a national study of pediatric reduction mammoplasty, investigators pulled 1,589 cases with CPT 19318 (2012-2020) and stratified patients by body-mass index (BMI). After adjustment, each one-unit rise in BMI increased the odds of superficial surgical-site infection (SSI) by 5% (OR 1.05, 95 % CI 1.01-1.09).13 The exercise teaches trainees how a single continuous NSQIP variable (BMI) can serve as the exposure, while superficial SSI—one of the standard 30-day wound outcomes—functions as the endpoint.
Case-control
Workflow. When the outcome is uncommon or analytic efficiency is desired, trainees can sample “cases” with the complication and select “controls” without it from the same PUF. Matching on operative year or CPT family and analyzing with logistic regression minimizes confounding by time or procedure mix.14
Example. Authors studying combined oncologic procedures identified 83,885 women who underwent total mastectomy (2007-2019). Patients receiving mastectomy + immediate breast reconstruction (IBR) were treated as “cases,” while mastectomy-only patients served as “controls.” After adjustment, IBR carried a modestly higher complication risk (OR 1.11) whereas adding bilateral salpingo-oophorectomy (BSO) did not alter risk.15 Residents quickly grasp that exposures can be composite CPT groupings and that every postoperative complication, readmission, or reoperation needed for the analysis is already coded. This example also teaches how the NSQIP can be used to analyze the effect and outcomes of concurrent surgeries.
The myriad variables contained in NSQIP allow for a department to design many unique studies to fit their residents or students’ particular interests. An example of how applying permutations of independent and dependent variables in the NSQIP can result in a project for every trainee to lead is displayed in Figure 1.

A Modular Curriculum for Residents and Students
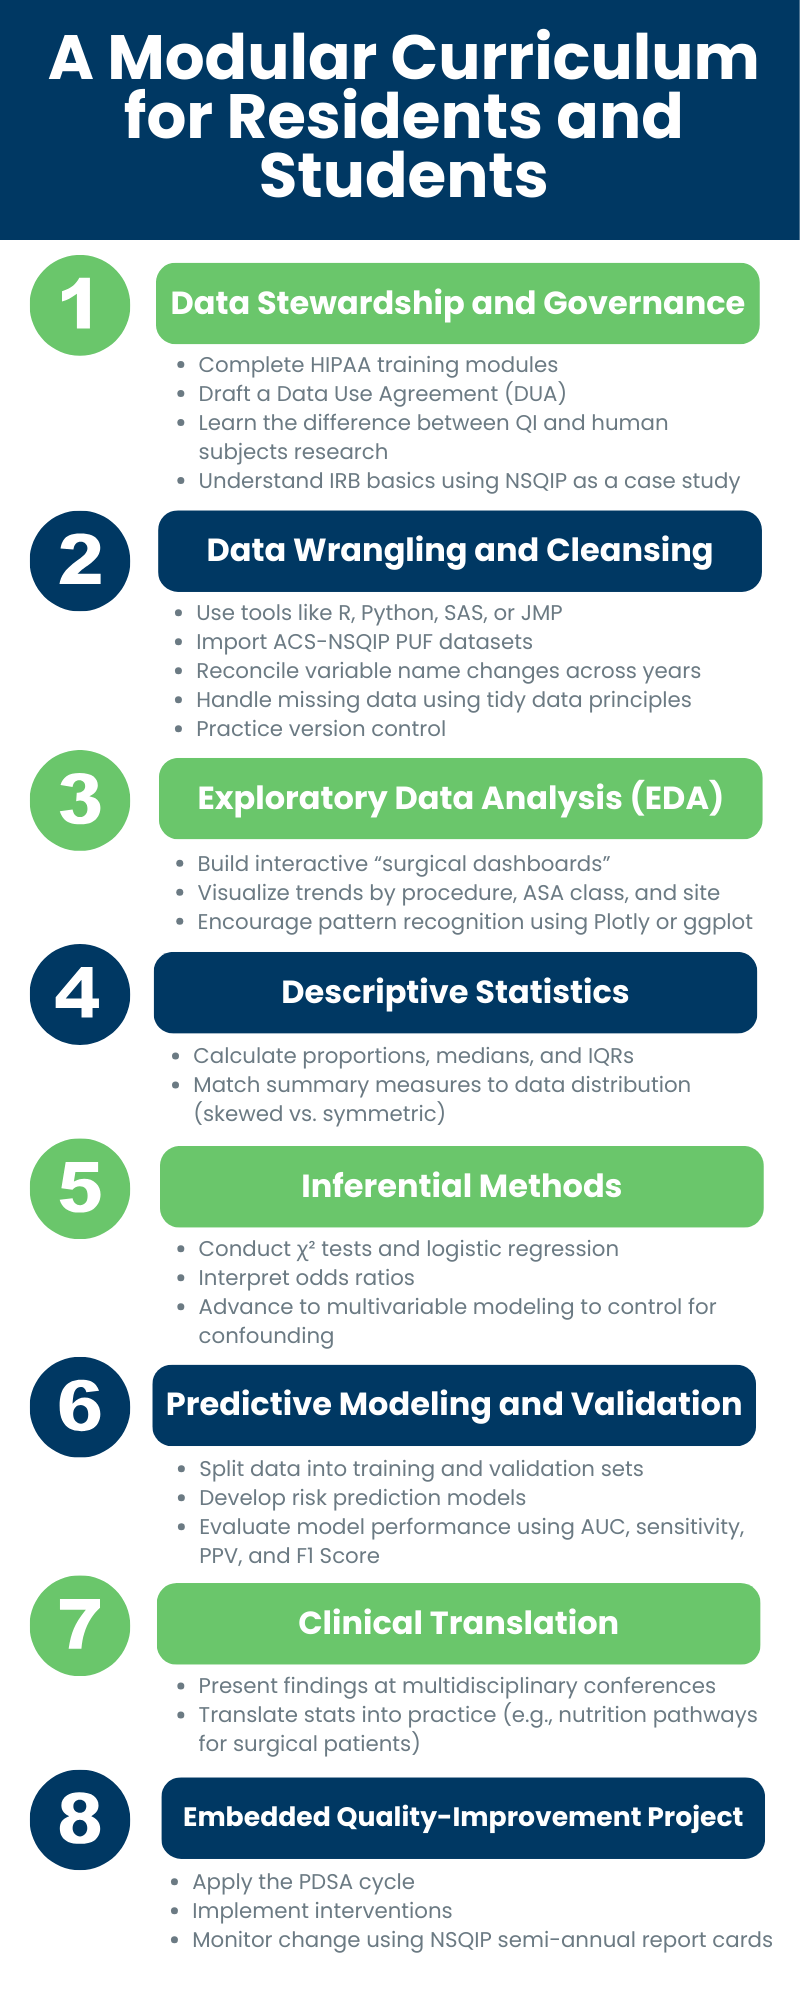
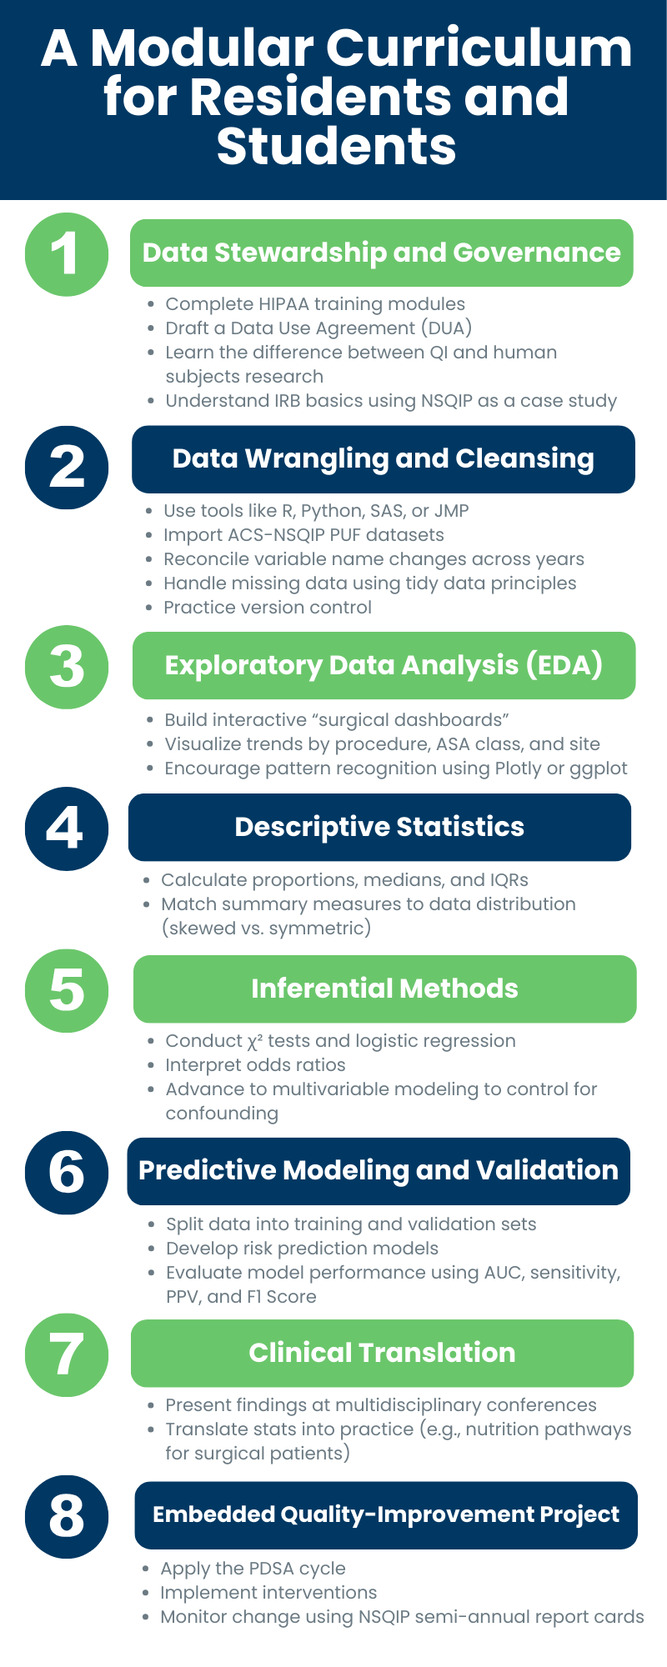
To translate database access into measurable educational gains, we recommend an eight-module curriculum delivered either as an intensive “data boot camp” or as a longitudinal thread woven through each postgraduate year (Figure 2).
-
Data Stewardship and Governance – Trainees begin by completing HIPAA modules and drafting a data-use agreement that distinguishes QI from human-subjects research (The use of NSQIP does not qualify as human subjects research as defined by US Department of Health and Human Services (HHS) regulations16). This introductory step underscores professional responsibility while demystifying institutional review board (IRB) processes.
-
Data Wrangling and Cleaning – Using R, Python, SAS, JMP, or other starter notebooks, learners import an ACS-NSQIP PUF, reconcile variable name changes across release years, and address missingness. Faculty emphasize tidy-data principles and version control.
-
Exploratory Data Analysis (EDA) – Residents develop “surgical dashboards” that visualize complication rates by procedure, ASA class, and hospital site. Interactive plots created in Plotly or ggplot encourage diagnostic curiosity and pattern recognition.
-
Descriptive Statistics – Learners compute proportions, medians, and inter-quartile ranges for key covariates, practicing correct selection of summary measures for skewed versus symmetric distributions.
-
Inferential Methods – Guided workshops walk through χ² testing, logistic regression, and interpretation of odds ratios, progressing to multivariate modelling to account for confounding variables.
-
Predictive Modelling and Validation – Advanced trainees split data into development and validation cohorts, fit risk-prediction models, and evaluate performance with the area under the receiver operating characteristic (ROC) curve and metrics such as sensitivity, positive predictive value (PPV), and the F1 Score.11
-
Clinical Translation – Each team presents its findings at a multidisciplinary conference, translating statistical outputs into concrete practice recommendations—for example, a nutrition optimization pathway for hypoalbuminemic patients undergoing panniculectomy.17
-
Embedded Quality-Improvement Project – Finally, learners employ the Plan-Do-Study-Act (PDSA) cycle, implement the agreed intervention, and monitor NSQIP semi-annual report cards to quantify impact.18
Illustrative Teaching Case: Frailty-Based Risk Stratification for Respiratory Complications After Video-Assisted Thoracoscopic Surgery (VATS)
Clinical Scenario & Cohort Definition
A PGY-3 resident observes that several ostensibly “average-risk” (ASA III) patients require unexpected postoperative ventilation after video-assisted thoracoscopic surgery (VATS). To test whether the 5-item Modified Frailty Index (MFI-5)—derivable completely from existing NSQIP variables—adds predictive value within this single ASA class, she extracts the 2008-2021 ACS NSQIP Participant Use Files. Applying VATS-specific CPT codes yields 69,145 cases; records lacking any MFI-5 component or key covariate are excluded.19
Analytic Steps Performed by the Resident
-
Compute Frailty.
Each patient receives one point for chronic heart failure, COPD, hypertension, diabetes, and non-independent functional status, yielding an MFI-5 score of 0-5. -
Descriptive Exploration.
Median age 65 years; 52 % female; 66 % ASA III. Overall unplanned intubation and ventilator dependence > 48 h occurred in 1.8 % and 1.7 % of cases, respectively. -
Bivariable Association.
Within ASA III patients, each one-point rise in MFI-5 is accompanied by step-wise increases in both outcomes (χ² p < 0.001). There is no meaningful outcome difference between ASA I and II, underscoring the value of a more granular frailty measure. -
Multivariable Modelling.
A multivariate logistic regression adjusting for age, sex, smoking, and steroid use shows that ASA III patients with an MFI-5 score of 3 have odds of re-intubation five-fold higher than those with MFI-5 score of 0 (OR 5.1, 95 % CI 3.7-7.0) and similarly elevated odds of prolonged ventilation.19 -
Model Comparison.
The resident evaluates model performance (adjusted R²). ASA class alone explains more variance than MFI-5 alone but adding MFI-5 to ASA improves prediction for both outcomes (ΔR² +1.5 %, p < 0.001).19,20
Interpretation and Teaching Points
-
Complementary Classifiers. ASA captures physiological reserve but is partly subjective21; MFI-5 captures comorbidity burden objectively. Combining them yields the best discrimination.
-
Risk Within the “Middle.” Trainees learn that the greatest educational payoff often lies in stratifying ASA II-III patients, where clinical intuition may underestimate hidden vulnerability.
-
Actionability. Because MFI-5 items are modifiable (e.g., optimization of heart failure, pulmonary pre-habilitation), the team proposes a targeted pre-operative pathway for patients with MFI-5 ≥ 2.
-
Quality-improvement Loop. Residents incorporate these findings into their M&M conference and design a PDSA cycle to track re-intubation and ventilation metrics quarterly.
Why This Case Matters Pedagogically
The example demonstrates a complete analytic arc—from question formulation through statistical modelling to bedside translation—within the same NSQIP environment learners will use throughout the curriculum. It reinforces core lessons about multivariable adjustment, additive model performance, and the practical limits of widely used clinical scoring systems, all while remaining squarely relevant to peri-operative care.
Discussion
Competency-based medical education (CBME) demands that residency curricula map explicit learning activities to observable milestones in knowledge, skills, and systems-based practice.22 The NSQIP-centered framework proposed here aligns naturally with that mandate: trainees practice data stewardship, risk-adjusted modelling, and quality-improvement (QI) cycles that correspond to the ACGME Milestones for systems-based practice, practice-based learning, and patient care — all of which emphasize continuous outcome tracking and evidence-based change management.23 By converting abstract milestones into concrete tasks (e.g., generating an odds ratio or designing a Plan-Do-Study-Act cycle based on institutional complication data), the curriculum offers program directors a transparent, metric-driven pathway for assessing progression along the CBME continuum.
The NSQIP approach also complements well-established training resources such as the Institute for Healthcare Improvement (IHI) Open School24 and the Surgical Counsel on Resident Education (SCORE) Portal.25 IHI courses provide foundational QI vocabulary and introduce tools like run charts and PDSA cycles, but they rely on hypothetical data sets; embedding those same tools in a live, nationally benchmarked registry like the NSQIP bridges the gap between theory and practice. Likewise, SCORE’s weekly modules ensure cognitive coverage of surgical pathophysiology and patient care, yet they do not teach residents how to manipulate large datasets or evaluate institutional performance trends. Incorporating NSQIP analytics therefore fills a recognized skills gap, turning residents into “surgeon-data scientists” who can translate textbook knowledge into measurable patient-level improvements.
Although NSQIP is designed for surgical data, the same instructional framework can be applied to other clinical registries, such as the STS Adult Cardiac Database,26 the National Cardiovascular Data Registry,27 or the Society of Hospital Medicine’s BOOST program.28 The essential tasks—gaining access to de-identified data, performing basic and multivariable analyses, and using results to inform local quality-improvement efforts—are broadly similar. Adapting the modules mainly involves substituting the relevant procedure codes and outcome definitions, allowing the curriculum to fit a range of specialties.
Lastly, residents who have mastered NSQIP analytics can pay those skills forward by guiding medical students and junior trainees through their first encounters with large clinical datasets. Acting as near-peer teachers not only reinforces the residents’ own statistical knowledge but also cultivates professional identity and communication skills. In anesthesiology, structured “resident-as-teacher” initiatives show that day-to-day mentoring—orienting learners, supervising tasks, and offering feedback—improves both learner outcomes and resident confidence as educators.29 Adopting a similar approach in a data-science curriculum helps ensure that basic quantitative skills are passed along to the next group of trainees.
Conclusion
ACS-NSQIP provides a ready-made, nationally benchmarked dataset that can anchor a structured curriculum in data exploration, statistical analysis, and quality improvement for residents and medical students. By guiding residents from data stewardship through multivariable modelling to actionable QI projects, programs can meet ACGME milestones while simultaneously improving patient outcomes. The framework is scalable—adaptable to other specialties with robust registries—and sustainable, as residents who master these skills can mentor incoming cohorts, reinforcing a culture of quantitative literacy. Future work should evaluate long-term educational outcomes and institutional performance metrics after widespread adoption, but the evidence to date suggests NSQIP offers a practical, high-impact platform for training the next generation of clinician-scientists.
Conflict of Interest Statement
The authors declare that none among them possess any conflicts of interest, including relevant financial interests, activities, relationships, and affiliations, that would in any way affect this manuscript or its conclusions.
Funding/Support Statement
This work received no funding or material support.
Data Sharing Statement
No data was used in this study.
Financial Disclosure and Products
None of the authors has a financial interest in any of the products, devices, or drugs mentioned in this manuscript.
Declaration of generative AI and AI-assisted technologies in the writing process
During the preparation of this work the authors used OpenAI ChatGPT-o3 to revise the wording of minor editorial content. After using this tool, the authors reviewed and edited the content as needed and take full responsibility for the content of the publication.