Introduction
Definition and purpose
A bibliometric analysis is a systematic method for quantitatively evaluating scientific literature to identify patterns, trends, and key contributions within a specific field of study.1 This approach relies on mathematical and statistical techniques to analyze bibliographic data, such as publication records, citation metrics, and authorship details, typically sourced from databases such as PubMed, Scopus, Web of Science, or Google Scholar.2 By examining the relationships and impacts of published works, bibliometric analysis provides a comprehensive understanding of research activity and its development over time.
The primary objective of bibliometric analysis is to provide insights into the evolution and structure of a research domain.3 Researchers use it to uncover historical trends, measure the impact of specific studies or authors, and identify influential journals or institutions. It also helps in discovering emerging topics, collaborative networks, and areas requiring further investigation. This analysis is particularly useful for guiding new researchers or organizations in identifying key contributors, highly cited articles, and research gaps, especially important for global threats such as the COVID-19 pandemic.4
Bibliometric analysis has wide-ranging applications across disciplines. In academia, it supports systematic literature reviews by identifying foundational works and influential frameworks. For policymakers, it provides evidence-based insights to allocate funding and prioritize research initiatives.5 Institutions use bibliometric studies to benchmark their performance, assess the productivity of faculty members, and identify collaboration opportunities.6 This approach also plays a critical role in interdisciplinary studies, helping to trace how knowledge flows between fields and facilitating the integration of ideas. In medicine, bibliometric studies can highlight emerging therapies or innovative methodologies by tracking citations and keywords in leading journals.7,8
History and evolution of Bibliometrics
Bibliometric analysis has its roots in the intersection of information science, statistics, and scholarly publishing. Its development was driven by the need to evaluate and organize the ever-growing body of scientific literature systematically. The origins of bibliometric analysis can be traced to the early 20th century, with foundational ideas emerging from librarianship, citation analysis, and the sociology of science.
The conceptual foundation for bibliometric analysis was created by Paul Otlet and Henri La Fontaine, whose efforts to organize global knowledge culminated in the development of the Universal Decimal Classification.9 This system sought to categorize and systematize information, serving as a precursor to bibliometric methods. Librarians and early information scientists began developing methods to classify and manage large volumes of scholarly materials. The emergence of library cataloging systems provided the groundwork for later bibliometric practices.10
One of the earliest examples of citation-based analysis came from Gross and Gross,11 who analyzed chemistry journal citations to identify influential journals. This marked the start of systematic efforts to evaluate scientific literature quantitatively. Samuel C. Bradford12 introduced Bradford’s Law of Scattering, which demonstrated how articles on a specific topic are unevenly distributed across journals. His work became instrumental in identifying core journals in various disciplines. Another foundational contribution came from George Zipf13 whose statistical analysis of word frequencies, known as Zipf’s Law, was later adapted to analyze patterns in scientific publications and citations.
The term “bibliometrics” was coined by Alan Pritchard,14 who defined it as “the application of mathematical and statistical methods to books and other media of communication.” This provided a formal identity to the field. One of the most transformative contributions came from Eugene Garfield in the mid-20th century. In 1955, Garfield introduced the concept of citation indexing15 which enabled researchers to trace connections between papers. His creation of the Science Citation Index (SCI) in 1964 revolutionized the study of scholarly communication, making citation analysis widely accessible. Lotka’s Law described the frequency distribution of authorship in scholarly publications, showing that a small number of authors produce the majority of articles in a given field.16
With the advent of computers and digital databases in the 1980s, bibliometric analysis became more sophisticated. Digital tools like Web of Science and Scopus enabled researchers to perform large-scale analyses of citations, keywords, and collaborations. Network visualization tools such as VOSviewer and CiteSpace further enhanced the ability to explore relationships within bibliographic data.17
Derek J. de Solla Price (1963), often called the father of scientometrics, significantly influenced bibliometrics by studying the exponential growth of scientific literature. His concept of “Big Science” highlighted the increasing scale and complexity of research activities.18
In the realm of sociology, Robert K. Merton (1968) provided a theoretical foundation for citation practices. His “Matthew Effect” described how prominent scientists often receive disproportionate credit, influencing patterns of recognition in academia.19
Review
Key Components of Bibliometric Analysis20–22
-
Citation Analysis: This technique examines the frequency and patterns of citations a publication, author, or journal receives. It provides an indicator of the work’s impact within the scientific community.
-
Co-Citation Analysis: This method explores the relationships between articles that are frequently cited together, revealing connections and clustering within the research field.
-
Keyword Analysis: By analyzing recurring keywords, researchers can track dominant themes and emerging areas of interest within a discipline.
-
Authorship and Collaboration Analysis: This aspect focuses on the productivity of individual authors or institutions and the extent of collaboration within the research community.
-
Bibliographic Coupling: This approach identifies links between articles based on shared references, which can indicate intellectual similarities or influences.
-
Network Visualization: Software tools are often used to map and visualize complex relationships between authors, papers, or keywords, making it easier to understand research dynamics.
Step by Step Approach to performing a bibliometric analysis
Writing a robust bibliometric review requires careful planning, rigorous methodology, and clear presentation of results.23 Below is a step-by-step approach:
Define Your Research Scope and Objectives
-
Identify Research Goals: Decide what you aim to achieve—e.g., analyzing publication trends, and identifying key authors, institutions, journals, or topics in a medical field.
-
Set a time frame: Choose the publication period you wish to analyze (e.g., last 10 years).
-
Select a Topic/Field: Narrow down the focus to a specific topic, such as the use of tenecteplase in ischemic stroke,24 post-stroke depression,25 advances in autism,26 the doctor-patient relationship,27 or access to healthcare in rural communities.28The scope of the focus (whether narrow or broad) depends on the purpose of the review (what information is hoped to be gleaned from citation analysis).
Search and Collect Data
- Choose a Bibliographic Database: Use reputable databases like PubMed, Scopus, Web of Science, or Embase. Each have their pros and cons [Table 1].
-
Create a Search Strategy:
-
Use relevant keywords (e.g., “cardiovascular diseases”) and Boolean operators (AND, OR, NOT).
-
Apply filters for language, article type, and timeframe.
-
-
Download Records:
-
Export citation data, including titles, authors, abstracts, keywords, publication years, journals, and DOI.
-
Preferred formats include .csv, .xls, or .ris for further analysis.
-
Step 3: Data Cleaning and Preparation
-
Remove Duplicates: Use reference management software like EndNote, Mendeley, or Zotero to clean duplicates.
-
Standardize Data: Ensure consistent formatting for author names, affiliations, and journal names.
-
Filter Relevant Records: Exclude irrelevant articles based on abstracts and titles.
Step 4: Data Visualization
-
Use Software like VOSviewer, Gephi, or CiteSpace can create co-authorship, keyword co-occurrence, and citation network maps [Table 2]
-
Generate Charts and Graphs:
- Use tools like Excel or Tableau for simple trends and distribution graphs.
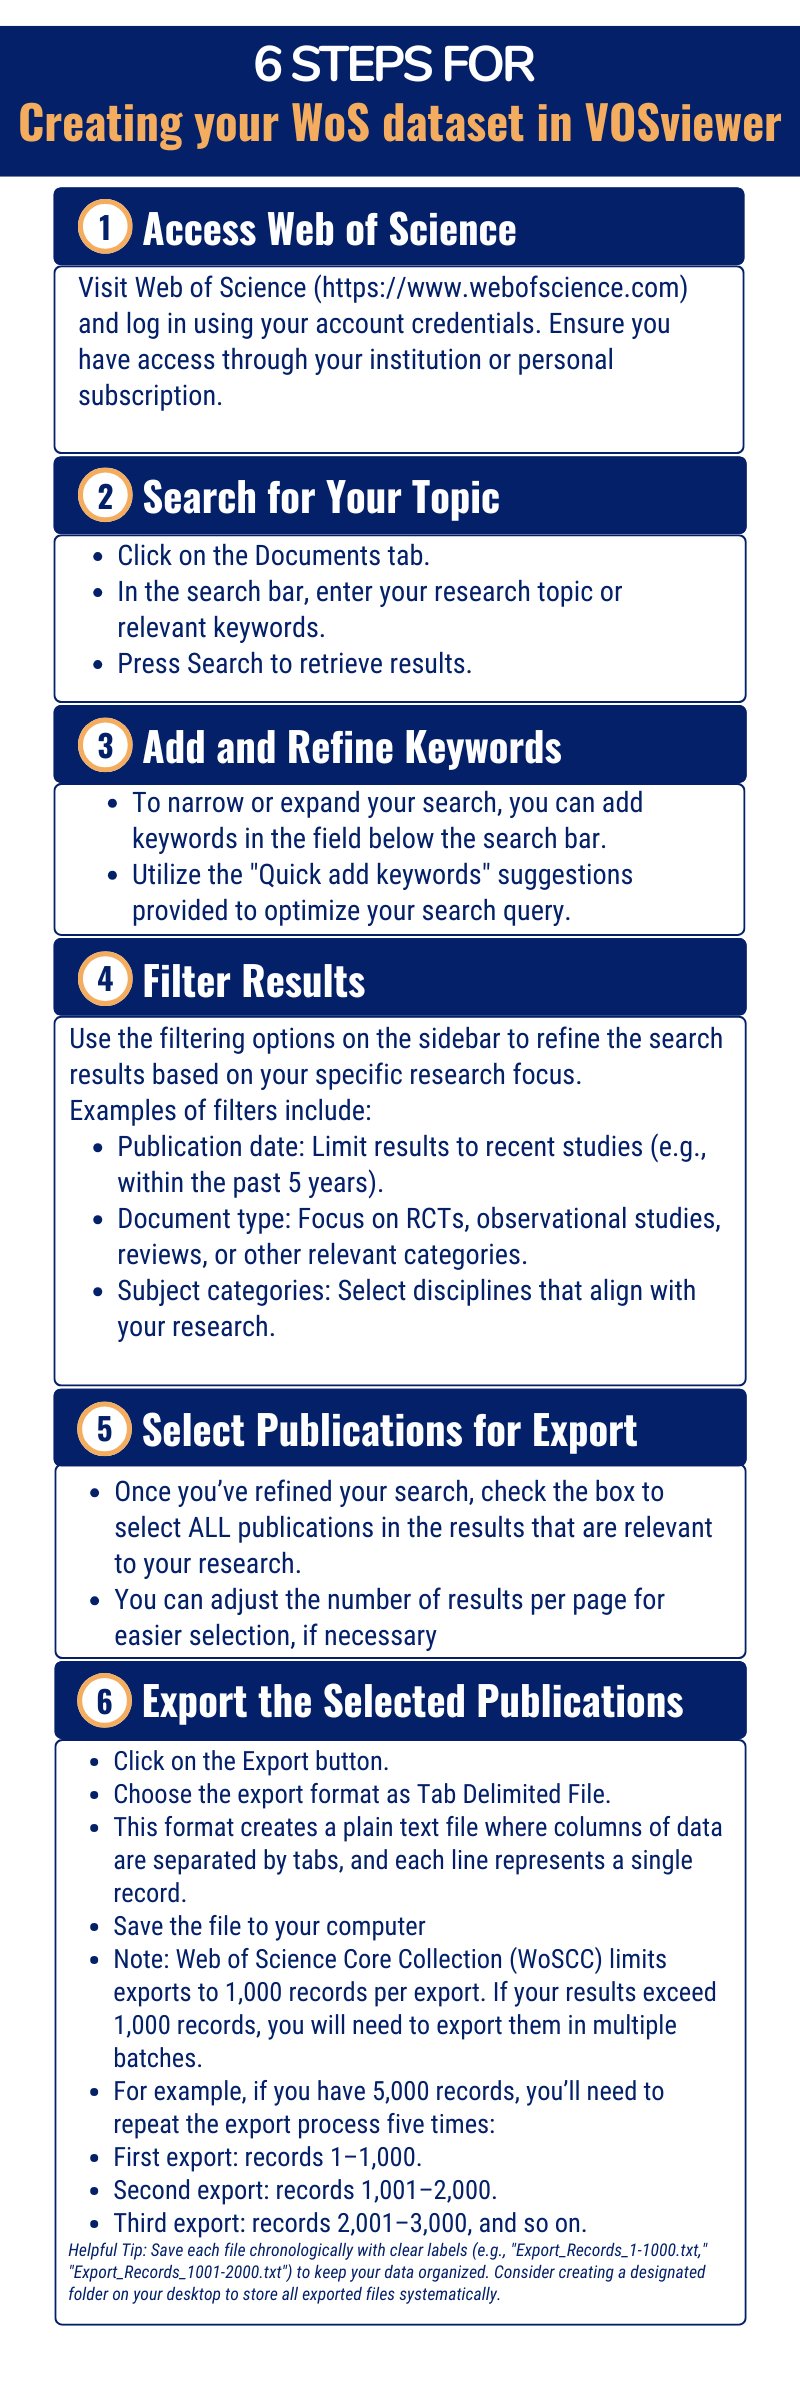
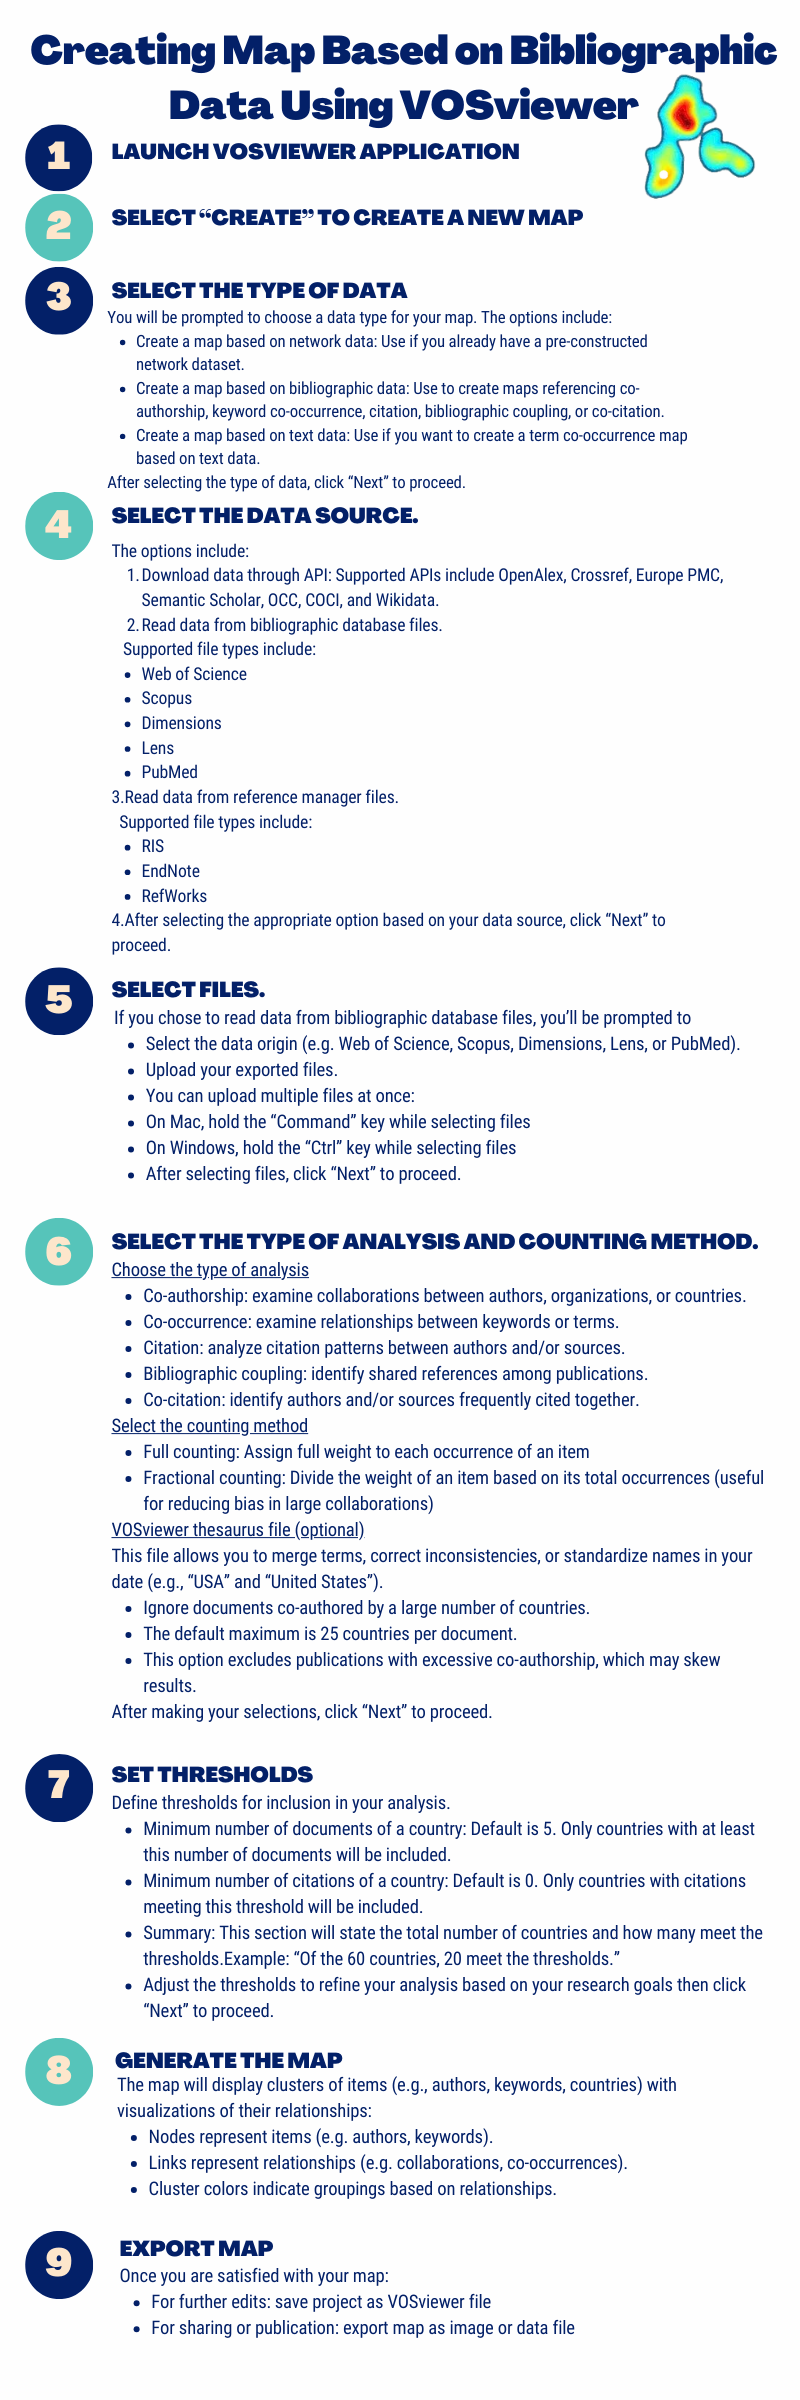
Figures 1 and 2 summarize in detail how to conduct a bibliometric analysis using VOSViewer software and data from Web of Science.


Limitations
Bibliometric analysis offers an objective, data-driven approach to evaluating scientific progress, enabling the identification of impactful research and influential contributors. It also facilitates a macro-level understanding of research trends, which is invaluable in a rapidly expanding scientific landscape. However, the technique has limitations.29 Over-reliance on citation metrics can skew interpretations, as high citation counts do not always equate to high-quality research. For example, bibliometric methods seldom account for the nature of citations—whether they are positive, negative, or purely perfunctory—and thus may inflate the perceived relevance of certain studies.30 Furthermore, the time-lag inherent in accruing citations often fails to reflect the current impact of newer work.31 Additionally, bibliometric tools generally neglect non-journal outputs, such as patents or policy documents, undervaluing important sources of practical influence.32 Lastly, biases inherent in bibliographic databases—such as limited coverage of certain languages or regions—can affect results.
Conclusion
Bibliometric analysis emerged from efforts to organize and evaluate scientific literature systematically, drawing on contributions from library science, documentation, and statistical analysis. Bibliometric analysis is a robust method for exploring and interpreting academic literature. By quantifying and visualizing research dynamics, it provides valuable insights into the development of scientific fields, supporting decision-making in academia, industry, and policy. Despite its limitations, bibliometric analysis remains a powerful tool for exploring the evolution of knowledge.